
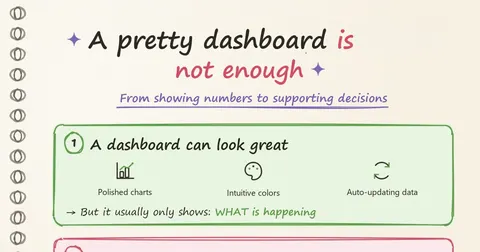
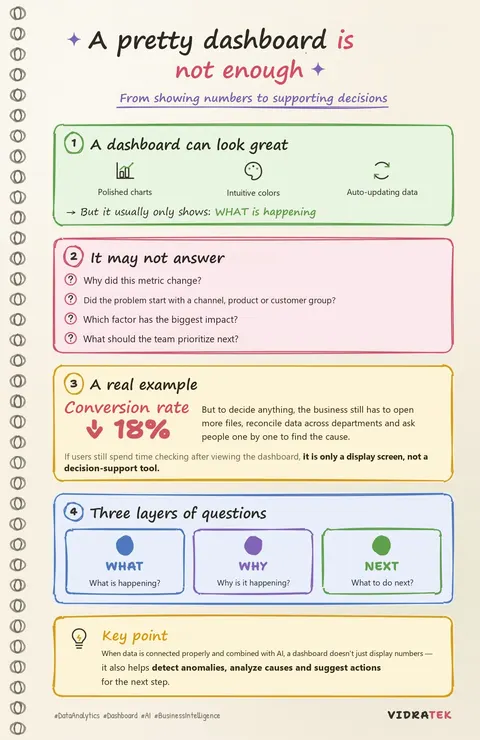
A pretty dashboard only answers “what is happening”, and that doesn't necessarily help you decide. A useful data system has to answer three layers of questions: What (what is happening), Why (why it is happening) and Next (what to do next).
Is a good-looking dashboard enough to make decisions?
A dashboard can look excellent: polished charts, intuitive colors and numbers that update automatically. But when revenue drops, costs rise or the conversion rate falls, the dashboard usually only tells us what is happening.
Which questions does a dashboard often leave unanswered?
A dashboard may not answer:
- Why did this metric change?
- Did the problem start with a particular channel, product or customer group?
- Which factor has the biggest impact?
- What should the team prioritize next?
Example: the conversion rate drops 18%
Say the dashboard shows the conversion rate down 18%. To decide anything, the business still has to open more files, reconcile data from several departments and ask people one by one to find the cause.
When is a dashboard just a display screen?
If users still spend time checking and reconciling data after viewing the dashboard, it is only a display screen. It is not yet a real tool for supporting decisions.
What are the three layers: What, Why, Next?
| Layer | Question | Meaning |
|---|---|---|
| What | What is happening? | Shows metrics and trends, for example revenue falling or the conversion rate dropping. |
| Why | Why is it happening? | Finds the cause: which channel, product or customer group, and which factor has the biggest impact. |
| Next | What should we do next? | Suggests priority actions for the team to take. |
What can connected data and AI add to a dashboard?
When data is connected properly and combined with AI, a dashboard doesn't just display numbers. It can also help:
- Detect anomalies in your metrics.
- Analyze the causes of a change.
- Suggest the right next action.
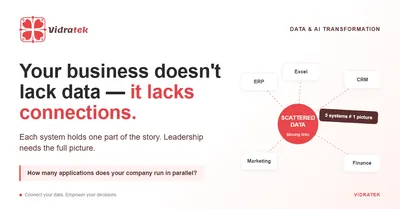
The foundation is data that is connected instead of scattered across systems. Read more in Enterprise data integration: you don't lack data, you lack connections.
Frequently asked questions about dashboards and decisions
Why isn't a good-looking dashboard enough to make decisions?
Because a dashboard usually only shows what is happening. It doesn't explain why a metric changed or what to do next.
What is the What, Why, Next model?
Three layers of questions a data system must answer: what is happening, why it is happening and what to do next.
When is a dashboard only a display screen?
When users still have to check and reconcile data after viewing it, the dashboard isn't yet a decision-support tool.
How does AI help a dashboard?
Once data is connected properly, AI can help detect anomalies, analyze causes and suggest the next action.
Where should a business start improving its dashboard?
Pick one key metric, list the Why and Next questions the dashboard doesn't answer, then connect the data needed to answer them.