
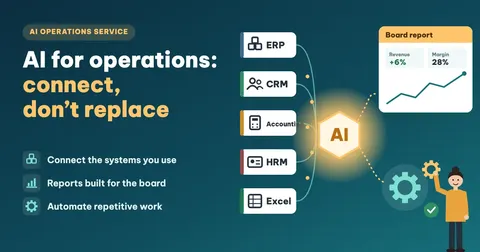
Plenty of companies want AI to make operations leaner but worry that it means throwing out the software they already run. In most cases it does not. The more useful work is connecting the systems you have, bringing the figures into one place so the board sees what it needs, and letting automated flows take over repetitive tasks.
Vidratek’s AI operations service covers exactly that: connecting your existing systems instead of replacing them, researching and building reports around what the board needs, and setting up automated flows for repetitive work. Below is how each part works, what you receive and how an engagement runs.
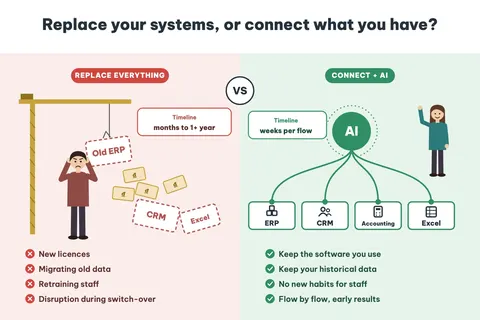
Why not replace everything just to use AI?
When digital transformation or AI comes up, many companies jump to buying a new all-in-one system. Sometimes that is the right call, but it usually costs more than planned. Beyond licences, customisation and implementation fees, years of customer, order and document data have to be cleaned and moved across, which is easy to get wrong. Every team has to learn new screens and is slower while it adjusts, and there is a period of running two systems side by side and fixing whatever breaks in the switch.
Meanwhile, in many companies each individual system works fine. What fails is that they do not talk to each other: figures are scattered, and any summary means exporting files and stitching them together by hand. Fixing that is usually much faster and cheaper than replacing everything.
Joining the systems you use into one source of figures
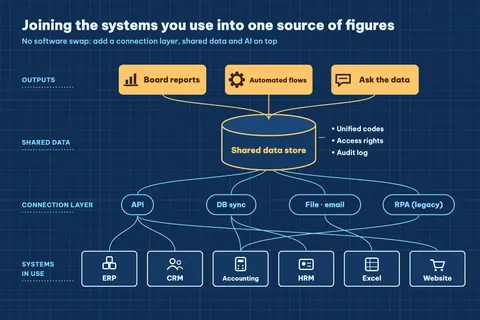
Vidratek leaves your software in place and adds a connection layer on top. It pulls data from the systems you use, standardises it and loads it into a shared data store, and the reports, automated flows and AI all work from that store.
How the data is collected depends on the system. ERP, CRM, accounting and sales platforms with APIs sync through the API, on a schedule or on events. On-premise software is read directly from its database in read-only mode, without touching the source system. Figures still kept in Excel or Google Sheets, or sent by email, are collected and format-checked automatically. For older software with no API, RPA (software robots that work the screens like a user) reads or enters the data.
Three things are set up in the shared store from day one: unified codes so each customer and product has one code across all systems, role-based access, and a log of every read and write.
Learn more about our system integration service and read Enterprise data integration: you don’t lack data, you lack connections.
Reports built around what the board needs
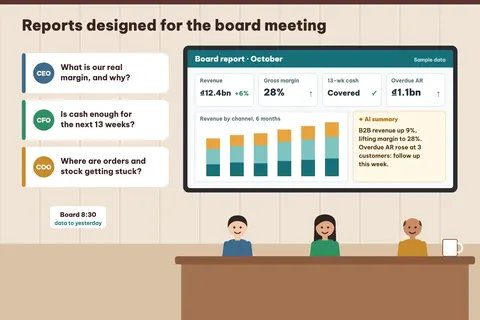
Many report sets are built from whatever data happens to exist. The board gets plenty of tables and still has to call finance or sales before it can decide anything. Vidratek starts from the other end, with the questions the board needs answered.
- Interview each board member: which decisions they make, weekly or monthly, and what information they are missing.
- Build a metric tree that splits each question into sub-metrics. "What is our real margin?" becomes revenue by channel and customer, cost of goods by product group and operating costs by department.
- Agree on definitions: is revenue recognised at invoicing or at delivery, and what makes a customer "active"? Each metric gets one definition used across the company.
- Map sources and frequency: which system each metric comes from, and whether it refreshes daily, weekly or monthly.
- Design the reports and dashboards: each page answers one group of questions, lets you drill from totals to detail, and carries an AI summary of what stands out.
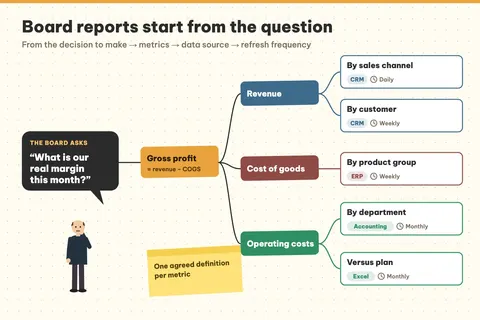
Board reports tend to circle a handful of familiar questions. Here is how a question turns into concrete metrics and data sources. See also: A pretty dashboard isn’t enough and Not all data needs to be real-time.
| Board question | Key metrics | Data sources | Frequency |
|---|---|---|---|
| What is our real margin this month, and why? | Gross profit by channel and product group; variance against plan | CRM, ERP, accounting, plan file | Weekly, closed monthly |
| Is cash enough for the next 13 weeks? | Cash-flow forecast, receivables and payables by due date | Accounting, bank | Weekly |
| Where are orders and stock getting stuck? | Late orders by step, stock below safety level | ERP, online store | Daily |
| Which channels and customers are growing or shrinking? | Revenue, order count and order value by channel and customer group | CRM, website | Daily |
| Are people costs on plan? | Payroll, overtime and headcount by department | HRM, accounting | Monthly |
Automated flows for repetitive activities
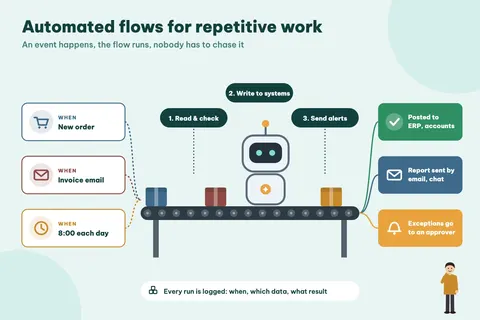
Once data is connected, a lot of repetitive daily work can run on its own. Each flow has a trigger (a new order, an invoice email, 8:00 in the morning), a few processing steps handled by AI and rules, and a result that is written to a system or sent to the right people. Some examples:
- Orders from your website or marketplaces go straight into the ERP: the order is created, stock is checked and the warehouse is told to prepare it.
- Emailed invoices go into accounting: AI reads each invoice, matches it with the purchase order, posts it and flags only the mismatches.
- Payment reminders: customers get a reminder on the due date, and the account owner hears about anything overdue.
- Morning report: at 8:00 each day, yesterday’s figures are compiled and sent to each manager by email or chat.
- Bank reconciliation: statements are matched with the books, leaving only unmatched lines for accounting.
- HR paperwork: new joiners get accounts and onboarding documents, with reminders for anything still missing.
Exceptions such as large amounts, missing data or cases with no rule go to the right approver with the reason attached. Every run is logged: when, which data, what result.
For how to choose what to automate first, see Bringing AI into everyday workflows, and for a worked example, 8:00 AM: your AI agent has already processed the data.
What you receive
| Area | What Vidratek does | What you receive |
|---|---|---|
| Discovery | Interviews with the board and teams; review of current systems and processes | System map, list of repetitive tasks, list of board questions |
| System connection | APIs, data sync, file collection, RPA; unified codes; access rights | Shared data store, connection and data-flow documentation |
| Board reports | Metric tree, definitions, dashboards, AI summaries and alerts | Report set, metric dictionary |
| Automated flows | Design, build and test each flow with real users | Running flows, run logs, exception-handling guide |
| Operations | Monitoring, fixing issues, adjusting when processes or source systems change | Regular operations report, proposals for next flows |
Results vary from company to company. The clearest gain is usually cost, since there is no software replacement and fewer hours go into repetitive work. The board also gets figures when it needs them instead of waiting for month-end, and numbers match better across departments because less is typed by hand.
To estimate what your current way of working costs, The real cost of manual reporting may help.
How an engagement runs
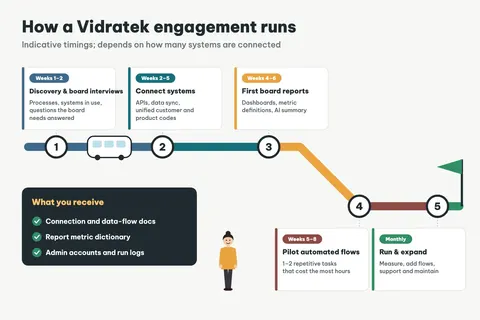
- Discovery and board interviews (weeks 1 to 2): understand the processes, the systems in use and the questions the board needs answered.
- Connect systems (weeks 2 to 5): set up connections, sync data, unify customer and product codes.
- First board reports (weeks 4 to 6): dashboards, metric definitions and AI summaries, which the board tries out and comments on.
- Pilot automated flows (weeks 5 to 8): automate the one or two repetitive tasks that cost the most hours.
- Run and expand (monthly): measure results, add flows, support and maintain.
These timings are indicative; the real schedule depends on how many systems are connected and how ready the data is.
Who is this service for?
The service suits companies running three or more systems (sales, accounting, inventory, HR and so on) whose figures do not match, or whose board reports are still assembled from many Excel files over several days each period. It also fits when repetitive daily tasks such as entering orders and invoices, reconciliation and reminders eat up hours, or when you want to use AI without replacing systems or putting sensitive data into public tools.
Our data and BI consulting team delivers it on the Vidratek AI Agent platform, and a maintenance and support plan can follow after handover.
Frequently asked questions
Do we have to replace the software we use?
No. Vidratek connects to your existing ERP, CRM, accounting, HRM and Excel. Staff keep working in familiar tools; the connection layer, reports and automated flows sit on top.
Can you connect older software that has no API?
Usually, yes. Depending on the case, data can be read directly from the database in read-only mode, collected from scheduled file exports, or handled with RPA working the screens like a user.
Is our data safe?
Access is role-based and every read and write is logged. The infrastructure can sit on your own servers or in the cloud depending on your security requirements, and personal data is handled under Vietnam’s Personal Data Protection Law.
How soon does the board get its first reports?
With two or three source systems that already hold stable data, the first report set is usually ready in about 4–6 weeks. Actual timing depends on the number of systems and how consistent the data is.
Can we make changes ourselves after handover?
Yes. You receive the connection documentation, the metric dictionary and admin accounts. Simple changes such as adding a filter or changing report recipients can be done in-house; larger changes are supported under an operations plan.